Lost time case rate -- setting up the Dashboard.
Setting up the Dashboard for lost time case rate.
 Similar questions: How to view lost time injury rate per unit?
In order to obtain correct graph on lost time case rate dashboard it is
necessary that man-worked hours are populated in the table of each unit taken
into account for each year depicted on the graph. Units not having worked hours
populated will have rate 0 on the dashboard for the period, where man-worked
hours are not indicated. Only lost time injury cases are taken into
consideration for this dashboard – injuries resulting to employee being unable
to perform his work for 1 working day or more.
- Go to
module and select
in the left side menu – second section will be lost time injury yearly rate, that is calculated as number of LTI cases x 200 000 / employee hours worked This formula is calculated per 200 000 or per 1 000 000 hours worked.
This graph shows by year lost time case rate based on how many LTI events have been reported that year and how many hours worked indicated for that year by certain units. Each organization unit has its color of the line on the graph, so it would be visually distinctive on the picture (colors of the unit are demonstrated on the top of the graph.
- In case not all units fit on one graph – click on the next page
above the dashboard to navigate to it
- Click on
to open the settings window, where you may select the graph type – vertical bars or a line. You may also set up the start and end year to view the graph for the period that you need.
· 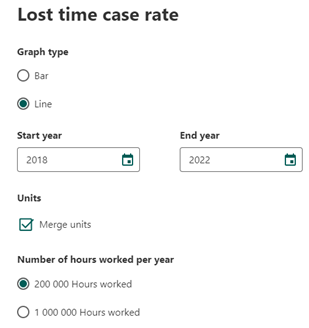
- Option to merge units
changes the graph with separate lines (or bars) for each unit into one line (or bar) that reflects the joint LTI case rate for entire organization.
- It is also possible to change the
formula by selecting whether calculation is done for 200 000 hours
worked per year or 1 000 000 hours.
Related Articles
Setting up Severity rate dashboard.
Settings for Severity rate Dashboard. Similar questions: How to adjust the Severity rate graph? To have a severity rate figure other than 0, a unit has to have man-worked hours indicated and lost time-injury cases associated with it with the number ...Exporting lost time case rate into Excels sheet.
How to export lost time case rate into Excels sheet? Similar questions: How to view LTI case rate in numbers? Only units that have man-worked hours populated and have had lost time injury incidents associated with them will have LTI rate above 0. ...How to set up DART rate dashboard?
How to set up DART rate dashboard? Similar questions: How to view the DART rate for selected organizational units? To have a DART rate figure other than 0 for a certain year, a unit has to have man-worked hours indicated for that year and lost ...Arranging OSHA incidence rate dashboard.
Setting up OSHA rate dashboard. Similar questions: How to view OSHA rate per each unit separately and for all organization combined? In order to obtain correct graph on OSHA rate dashboard it is necessary that man-worked hours are populated in the ...Setting up Number of events by type dashboard.
Set up Events by type dashboard Similar questions: How to adjust the events by type dashboard for unit statistics comparison? Number of events by type dashboard includes all the events associated with a certain unit for selected years or for entire ...